My Portfolio
Here are the websites and web applications I have built (other than this website):
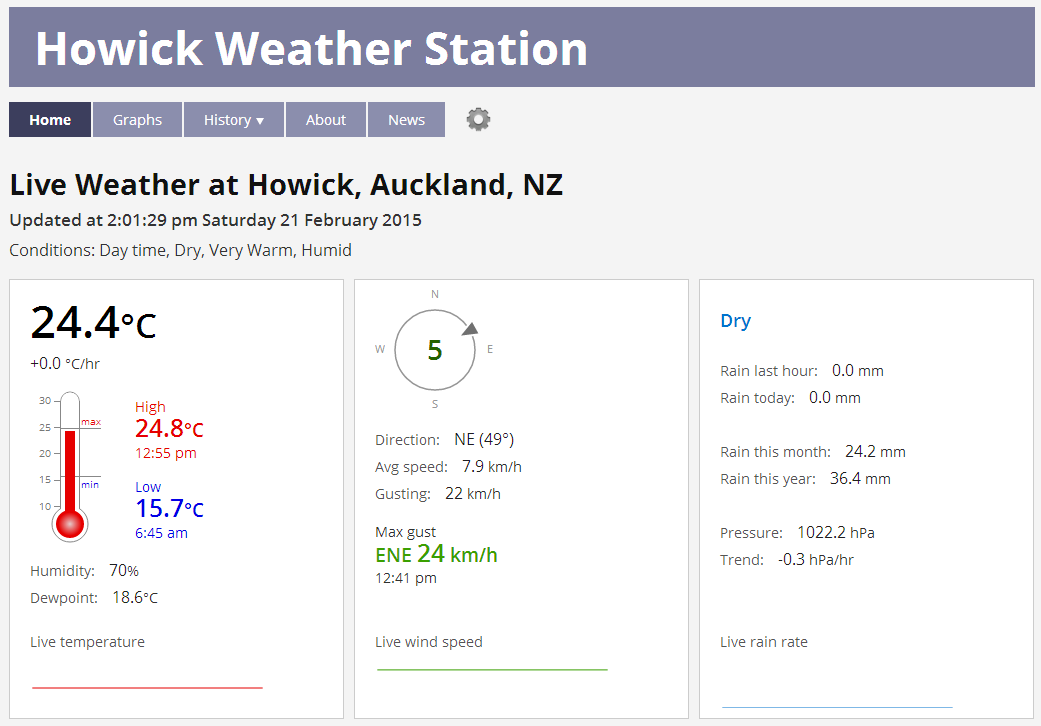
Howick Weather Station

I built this website to provide detailed weather data from my weather station to the local community. It is a very data-driven website. Built on the back-end with PHP and MySQL, the front-end technologies include D3.js and HighCharts as well as LoDash.js (a utilities libary). Home page updates near-realtime via AJAX.
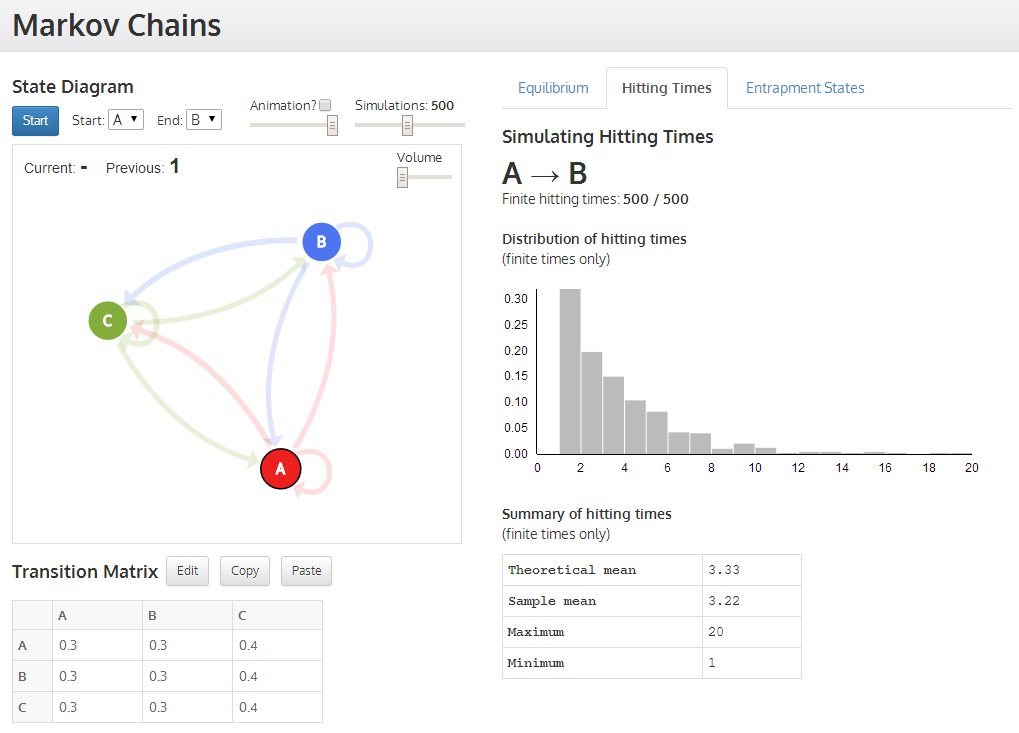
UoA - Markov Tool

A web-based application build for the Department of Statistics at the University of Auckland. Markov chains are used to model scenarios with a known number of possible states, and you can only be in a single state at one time. The Markov chain is defined by a probability transition matrix, which gives the probabilities of jumping from one state to the next. This application aims to help students understand what a Markov chain is and enables them to run simulations to show how it behaves over longer periods of time. Uses AngularJS, D3.js and the LoDash utitily library. Also uses Twitter bootstrap for CSS.
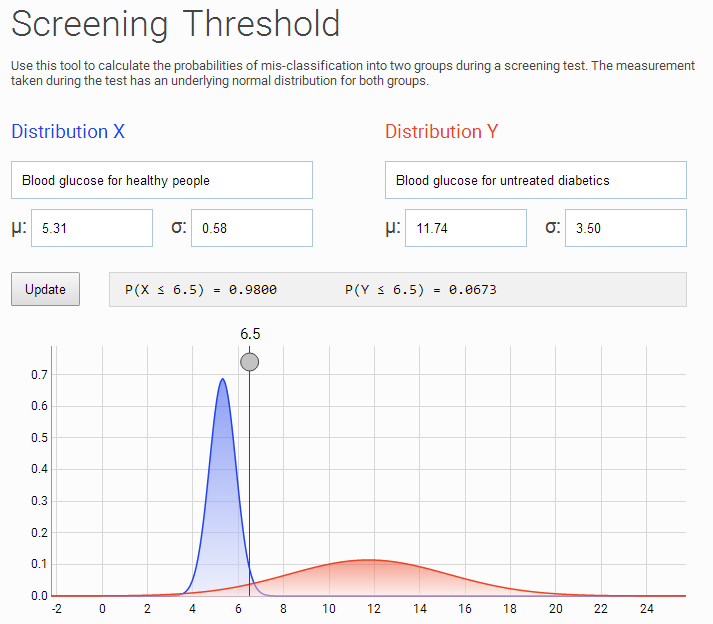
UoA - Screening Tool

Small web-based application, again for the Department of Statistics at the University of Auckland. It aims to demonstrate how a threshold value for a screening test is decided (e.g. blood glucose level for a Diabetes test). Assumes there are two populations whose measurements are both normally distributed (but with different parameters). A draggable slider lets the user change the threshold, and see the resulting probabilities of the test giving false positives and false negatives by using this threshold for classification. Uses the D3.js library.
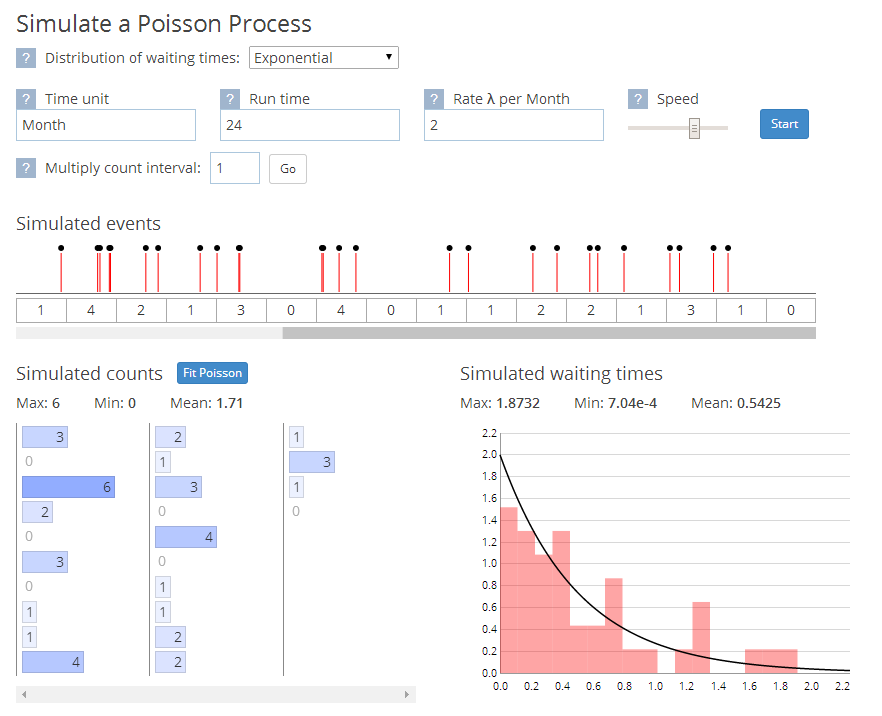
UoA - Poisson Tool

A web-based application built for the Department of Statistics at the University of Auckland. A Poisson process is a process where the waiting times between events follow an exponential distribution. There are two parts to this application. The first is for fitting a Poisson distribution to count data and seeing how good the fit is. The second part is for simulating events and count data in an effort to demonstrate that only the exponential waiting times will produce a set of counts that are Poisson-distributed. The events are simulated in real time as an animated "ticker" slides along, to help give a feel for what sort of waiting times are normal and that high counts (event clusters) are not actually unusual in many cases. Makes extensive use of the D3.js library.
